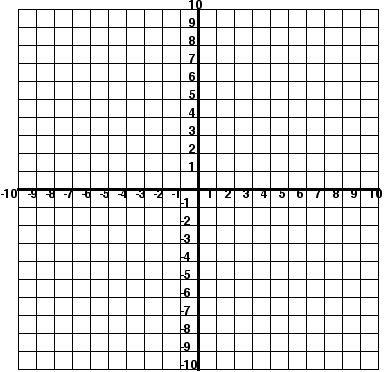
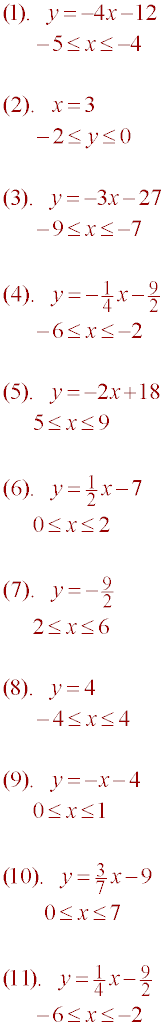
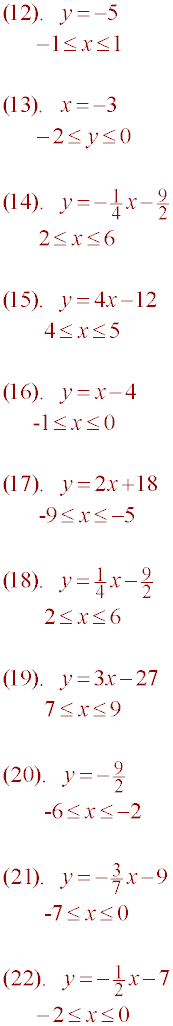
1. Draw the x- and y-axes on a sheet of graph paper with
domain -10 < x < 10 and range -10 < y < 10.
2. Then plot each of the lines below for the domain specified.
3. The result should be a picture.
|
|