Notice that in each of the graphs below, the graph is an exponential function.
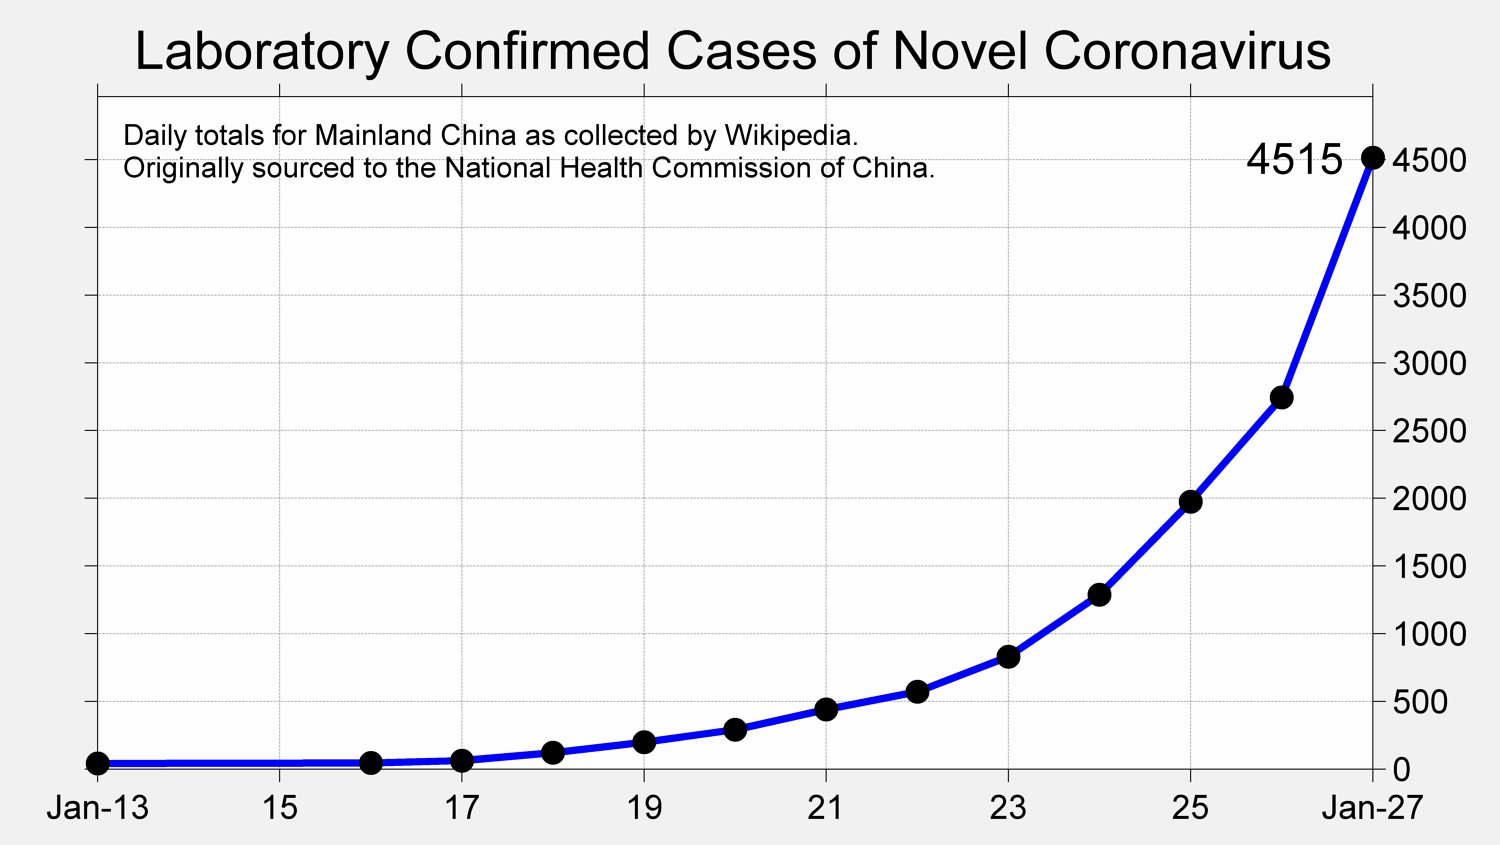
Exponential Graph of confirmed cases of the coronovirus in China (Jan 13 - Jan 27 of 2020)
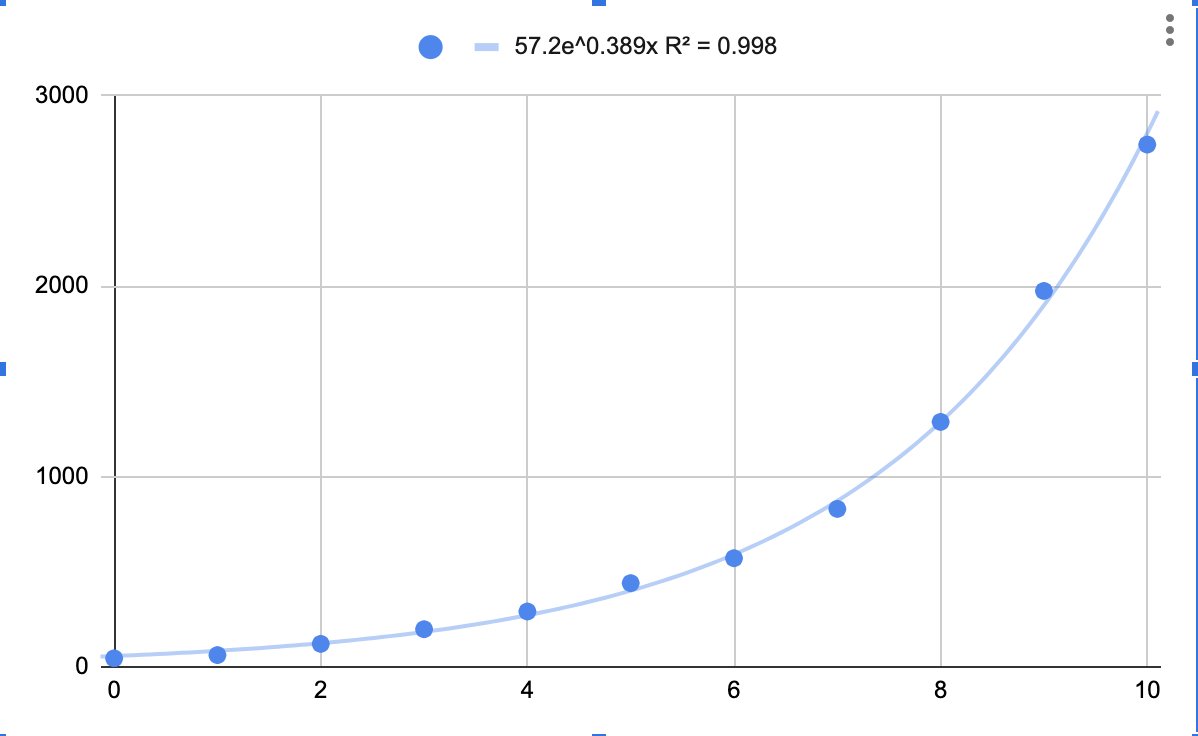
The exponential function y = 57.2 e0.389 x closely approximates the growth of the Coronavirus in China
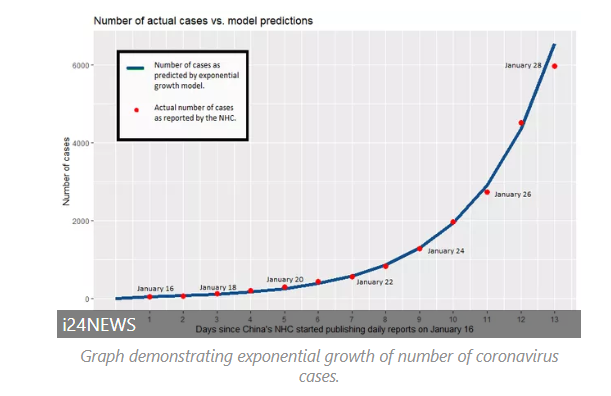
Exponential Growth of confirmed cases of the coronovirus in China (Jan 16 - Jan 28 of 2020)
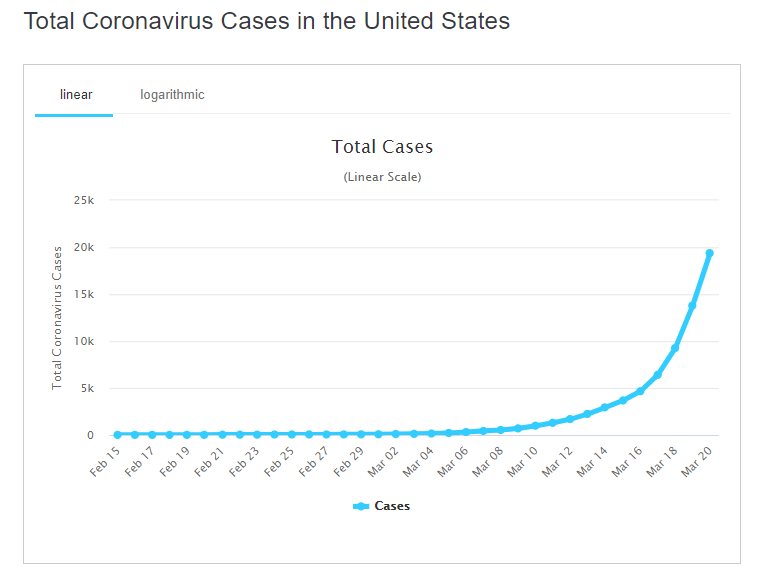
Total confirmed cases of the coronovirus in the U.S. (Feb 15 - Mar 20 of 2020)
Total confirmed cases of the coronovirus in Italy (through Mar 23, 2020)

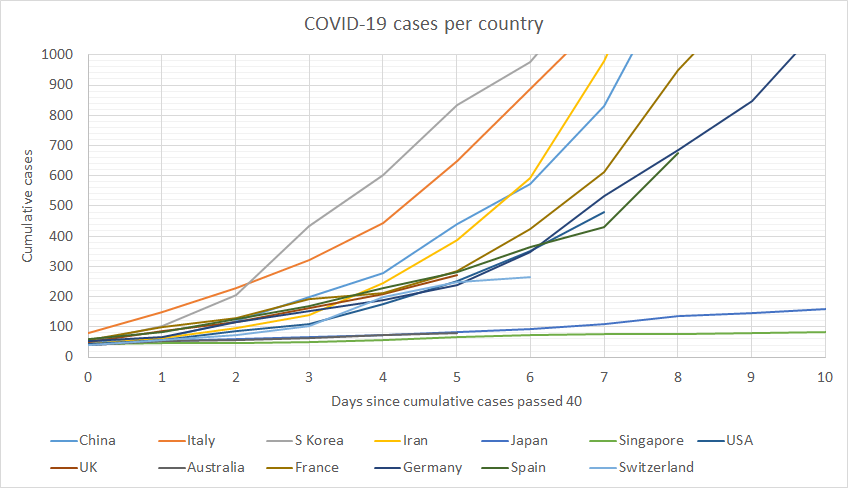
Total confirmed cases of the coronovirus by country (y-axis limited to 1,000 cases)
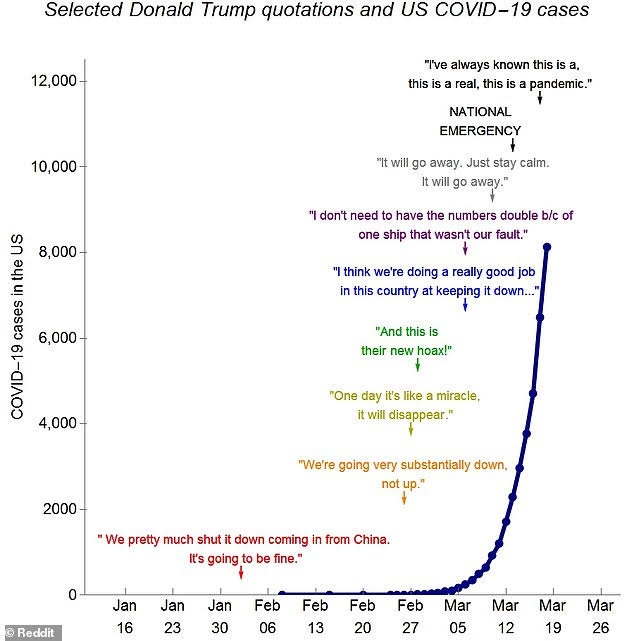
U.S. COVID-19 cases and Donald Trump Quotations
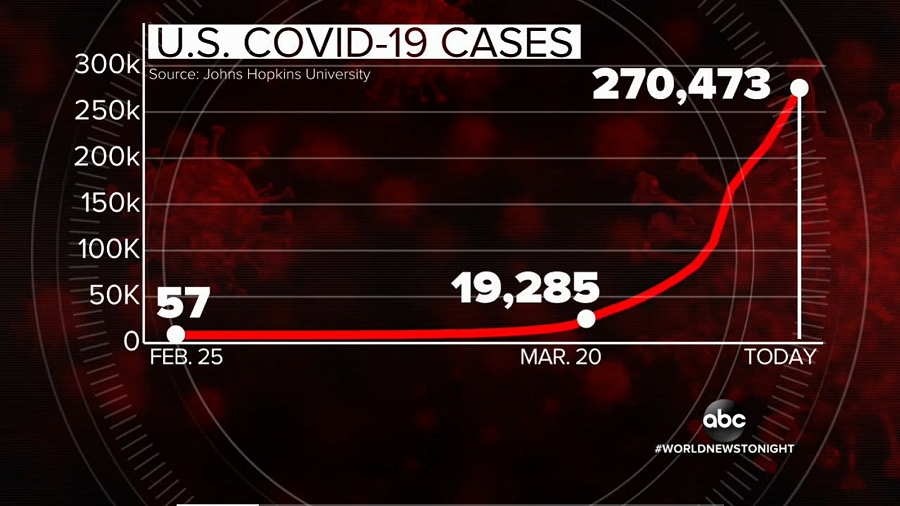
U.S. COVID-19 cases as of April 3, 2020 (two weeks since March 20)
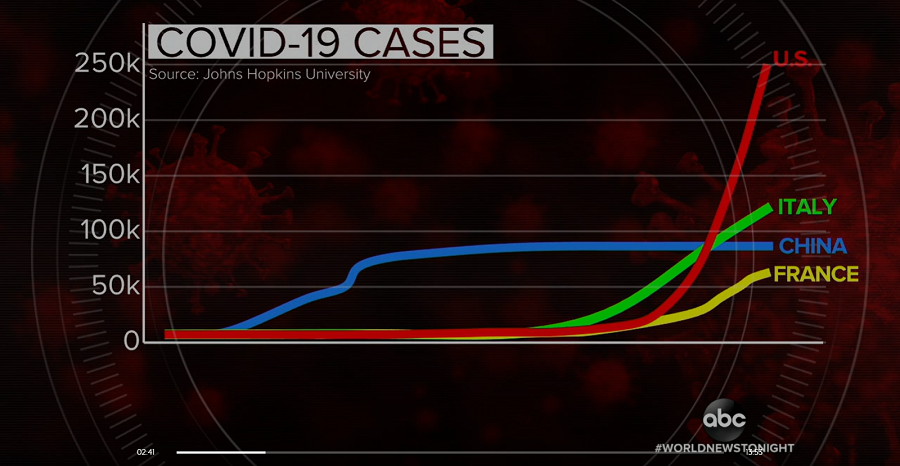
World COVID-19 cases
Click here for Memes about the COVID-19 Coronavirus