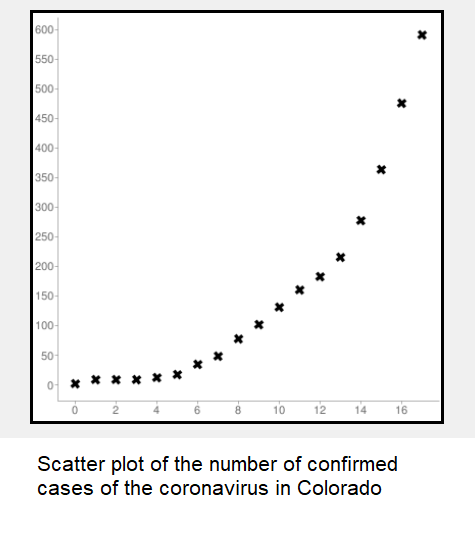
After viewing graphs of the number of confirmed cases of the coronavirus in China and the U.S. ( Click here to see the graphs),
I wondered if the cases in Colorado followed a similar pattern.
Here is the data for the first eighteen days from March 5, 2020 to March 22, 2020 in Colorado:
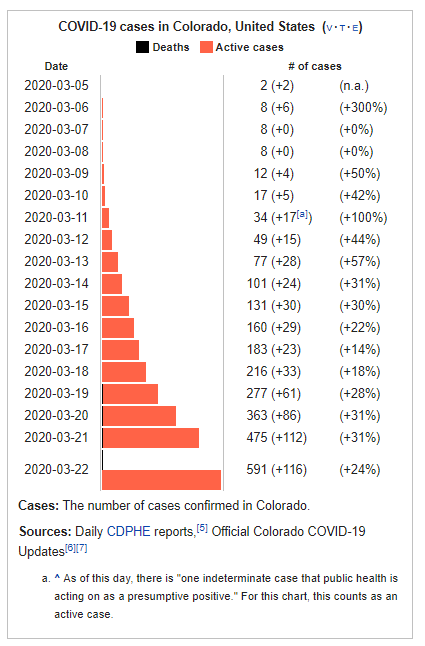
I gathered the data in the following table so that it can be used in this month's problem:
| Day | Cases |
|---|---|
| 0 | 2 | 1 | 8 | 2 | 8 | 3 | 8 | 4 | 12 | 5 | 17 | 6 | 34 | 7 | 49 | 8 | 77 | 9 | 101 | 10 | 131 | 11 | 160 | 12 | 183 | 13 | 216 | 14 | 277 | 15 | 363 | 16 | 475 | 17 | 591 |
Since it appears to be an exponential function, use the data for day #11 (160 cases) and day #15 (363 cases) to solve for A and B in the general exponential function
y = A eB x .
Now take this equation that you just found and let x = 9, then solve for y to see how close the model is to the actual number of cases.
You must show your algebra to get credit.
Solution to the Problem:
The answers are y = 16.81538 e 0.204807 x and y = 106.22.For x = 11: 160 = A e11 B
For x = 15: 363 = A e15 B
Solving for A in the second equation, we get: A = 363 / (e 15B)
Now subsitute in the first equation to get: 160 = (363 / (e 15B)) e 11B
This simplifies to: 160 = 363 e - 4B or 160 e 4B = 363
Dividing by 160: e 4B = 363 / 160
Now, take the natural log of each side: 4B = ln (363 / 160)
So, B = 0.204807
Now substitute back to get: A = 16.81538
Now take this equation, y = 16.81538 e 0.204807 x and replace x by 9 to get:
y = 16.81538 e ((0.204807)(9)) and therefore y = 106.22.
Correctly solved by:
| 1. Anna T. Vice |
Landon School, Bethesda, Maryland |
| 2. Kelly Stubblefield | Mobile, Alabama |
| 3. James Alarie | Flint, Michigan |
| 4. Brijesh Dave | Mumbai City, Maharashtra, India |